 kiruthika
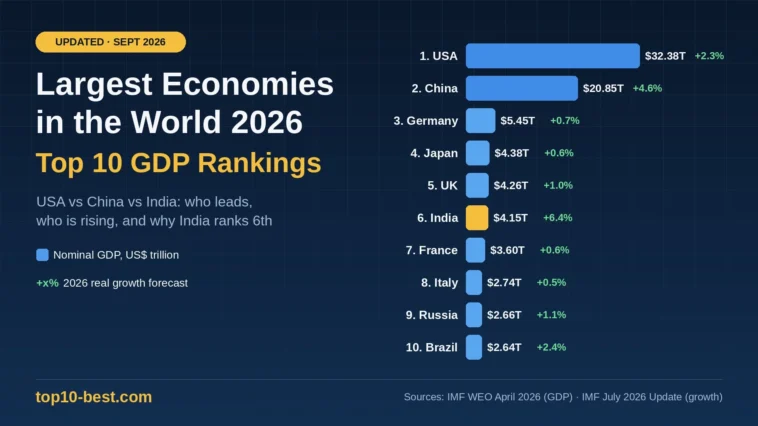
Who really runs the world economy in 2026? The top two names haven’t changed, but a lot is shifting below them. This guide ranks the largest economies in the world 2026 using official IMF data, explains why India sits 6th, and shows how a war and an AI boom are reshaping growth.
The big picture first. According to the IMF’s April 2026 estimates, world GDP is about $126.3 trillion this year, and the United States alone produces roughly a quarter of it.
Key Highlights
- USA ranks No. 1 at about $32.4 trillion (IMF, April 2026).
- China ranks No. 2 at about $20.9 trillion, but it is No. 1 by PPP.
- Germany holds 3rd, a spot it took from Japan in 2023.
- India ranks 6th in nominal GDP but 3rd by PPP.
- Brazil enters the top 10, and Canada slips to 11th.
- Italy moves ahead of Russia into 8th.
- Global growth for 2026 is 3.0% (IMF, July 2026).
- India has the highest projected growth rate of the ten economies on this list.
How GDP Rankings Work
Most “biggest economy” lists use nominal GDP. That is the value of everything a country produces in a year, converted into US dollars at market exchange rates.
The standard source is the IMF World Economic Outlook (WEO). Full editions come out in April and October, with shorter updates in January and July.
Step-by-Step: How a Country Gets Its Rank
- National statistics agencies measure output. Examples are the US Bureau of Economic Analysis and India’s statistics ministry.
- The IMF builds forecasts from that data.
- Local currency is converted into US dollars.
- Countries are sorted from largest to smallest. The IMF also publishes a separate PPP ranking.
Step 3 is the tricky part. If a currency weakens, the country looks smaller in dollars, even when real output is growing fast.
Top 10 Largest Economies in the World 2026
How to read this list: GDP size comes from the IMF April 2026 WEO, the latest dollar estimates. Growth rates come from the IMF July 2026 update, the latest forecasts.
1. United States: $32.38 Trillion
- 2026 growth: 2.3%
- GDP per person: about $94,430
The US leads by a wide margin, powered by tech, finance and consumer spending. The IMF credits fiscal support and strong technology investment. But 2026 hasn’t been smooth: the BEA reported real growth of just 1.5% (annualized) in Q2 2026, down from 2.1% in Q1.
2. China: $20.85 Trillion
- 2026 growth: 4.6%
China is closing the gap, but slowly. The US is still about $11.5 trillion ahead in nominal terms. The IMF says higher oil prices and long-running structural problems are holding China back this year.
3. Germany: $5.45 Trillion
- 2026 growth: 0.7%
Europe’s industrial powerhouse still leans on cars, machinery and chemicals. There was one bright spot: German GDP grew 1.4% in Q1 2026, double what the IMF expected in April.
[Insert image: Frankfurt skyline]
Caption: Frankfurt’s financial district. Germany ranks third among the largest economies in the world in 2026.
4. Japan: $4.38 Trillion
- 2026 growth: 0.6%
Japan is the only top-10 economy whose dollar GDP is projected to shrink this year, from $4.44 trillion in 2025. An ageing population drags on long-term growth. Still, its income per person is more than 12 times India’s.
5. United Kingdom: $4.26 Trillion
- 2026 growth: 1.0%
Services and finance drive the UK economy. The IMF expects growth to improve to 1.3% in 2027 as the energy shock fades.
6. India: $4.15 Trillion
- 2026 growth: 6.4% (FY2026-27)
- GDP per person: about $2,813
India’s projected nominal GDP ranks 6th in the IMF April 2026 estimates. Earlier IMF forecasts, from April 2025, had shown India narrowly passing Japan. That forecast is where the “4th largest” headlines came from.
Two things changed that. The rupee weakened against the dollar. And India’s February 2026 GDP revision to a new 2022-23 base year cut FY26 nominal GDP from ₹357.14 trillion to ₹345.47 trillion.
Real growth is still strong, driven by private consumption and services.
Note: on a calendar-year basis, the IMF projects India’s 2026 growth at 7.0%.
7. France: $3.60 Trillion
- 2026 growth: 0.6%
Tourism, luxury brands, aerospace and nuclear energy keep France in the top 10. The IMF cut its 2026 forecast by 0.3 points in July.
[Insert image: Mumbai skyline]
Caption: Mumbai, India’s financial capital. India has the highest projected growth among the top 10 largest economies in 2026.
8. Italy: $2.74 Trillion
- 2026 growth: 0.5%
Italy climbs to 8th by passing Russia. Growth, though, remains among the weakest of any major economy.
9. Russia: $2.66 Trillion
- 2026 growth: 1.1%
Russia slips to 9th. Higher commodity export earnings are keeping its growth steady.
10. Brazil: $2.64 Trillion
- 2026 growth: 2.4%
Brazil moves up from 11th and pushes Canada ($2.51 trillion) out of the top 10. The IMF raised Brazil’s forecast by 0.5 points in July, which makes it the second-fastest grower on this list after India.
Important Statistics Table
| Indicator (2026) | Figure | Source |
| World GDP (nominal) | ~$126.3 trillion | IMF WEO, April 2026 |
| US share of world GDP | 25.6% | IMF WEO, April 2026 |
| China share of world GDP | 16.5% | IMF WEO, April 2026 |
| Global growth forecast | 3.0% | IMF Update, July 2026 |
| Global growth (World Bank method) | 2.5% | World Bank GEP, June 2026 |
| Global inflation | 4.7% | IMF Update, July 2026 |
| US Q2 2026 real GDP growth | 1.5% (annualized) | US BEA, August 2026 |
| India growth | 6.4% (FY2026-27) | IMF Update, July 2026 |
The IMF and the World Bank weight countries differently, so their global growth figures don’t match.
Nominal vs PPP Comparison
PPP (purchasing power parity) adjusts for local prices. A dollar buys far more in Chennai than in Chicago, and PPP captures that.
| Country | Nominal Rank | PPP Rank | 2026 Growth |
| United States | 1 | 2 | 2.3% |
| China | 2 | 1 | 4.6% |
| Germany | 3 | 6 | 0.7% |
| Japan | 4 | 5 | 0.6% |
| United Kingdom | 5 | 10 | 1.0% |
| India | 6 | 3 | 6.4%* |
| France | 7 | 9 | 0.6% |
| Italy | 8 | 12 | 0.5% |
| Russia | 9 | 4 | 1.1% |
| Brazil | 10 | 8 | 2.4% |
Ranks come from the IMF April 2026 WEO, and growth figures from the IMF July 2026 update. *India’s figure is for FY2026-27.
By PPP, China’s economy is about $44.3 trillion, which is well ahead of the US.
Pros and Cons of GDP Rankings
| Pros | Cons |
| Easy to compare countries in one currency | Exchange-rate moves can change ranks quickly |
| Official IMF data, updated regularly | Does not measure living standards |
| Useful for investors, students and exam prep | Informal economies are hard to measure |
| Shows global purchasing power | Forecasts get revised, sometimes a lot |
Nominal GDP measures the size of an economy, not how well people live. For that, GDP per capita is the better comparison.
2026 Trends and Latest News
1. War and energy prices. The IMF’s July 2026 update describes two opposing forces. The Middle East war is hurting energy importers, while an AI-driven technology upswing is lifting other economies.
2. The AI boom. Tech-linked economies are outperforming. The IMF raised South Korea’s 2026 growth forecast to 2.6% on strong chip demand.
3. Inflation is back. Global inflation is projected at 4.7% in 2026, up from 4.1% in 2025. The IMF says the steady decline in inflation has stalled.
4. India vs Japan (projection). Some analyses of IMF data suggest India could pass the UK around 2027 and Japan around 2028. These are forecasts, not certainties, and currency moves could change the timing.
5. What’s next. The IMF’s October 2026 World Economic Outlook will refresh these numbers. This page will be updated when it’s released.
[Insert image: New York Stock Exchange]
Caption: Wall Street, the financial center of the United States, which remains the largest economy in the world in 2026.
Conclusion
The largest economies in the world 2026 list is still led by the US and China, but the middle keeps moving. India shows the strongest growth, Brazil is back in the top 10, and currency swings decide much of the order. Keep an eye on the IMF’s October 2026 update for the next reshuffle.
References
- IMF – World Economic Outlook Update, July 2026 – imf.org
- IMF – WEO Press Briefing Transcript, July 8, 2026 – imf.org
- IMF – World Economic Outlook, April 2026 – imf.org
- IMF DataMapper – GDP, Current Prices (April 2026) – imf.org
- StatisticsTimes – Projected World GDP Ranking 2026 (IMF data) – statisticstimes.com
- U.S. Bureau of Economic Analysis – GDP Second Estimate, Q2 2026 – bea.gov
- World Bank – Global Economic Prospects, June 2026 – worldbank.org
- Reuters – World Bank 2026 Outlook, January 2026 – reuters.com
- The Japan Times / Bloomberg – India’s GDP Revisions, February 2026 – japantimes.co.jp
- Outlook Business – India’s GDP Base-Year Revision Explained, February 2026 – outlookbusiness.com
- Business Standard – IMF India vs Japan Projection, 2025 – business-standard.com
- DD India – IMF Projects 6.4% Growth for India, July 2026 – ddindia.co.in
- Visual Capitalist – 2026 GDP Growth Forecasts, April 2026 – visualcapitalist.com
FAQs
The United States, with a nominal GDP of about $32.38 trillion (IMF, April 2026).
Not in the latest IMF data. India ranks 6th in nominal GDP in the IMF April 2026 estimates, and 3rd by PPP.
A weaker rupee and India’s February 2026 GDP base-year revision lowered its GDP in dollar terms, compared with earlier IMF forecasts.
Among the top 10, India leads with 6.4% projected growth for FY2026-27. Among major economies worldwide, Vietnam is forecast at 7.5%.
Only by PPP (about $44.3 trillion vs $32.4 trillion). In nominal dollars, the US leads by about $11.5 trillion.
Canada, which slipped to 11th after Brazil moved up.
The IMF releases full forecasts in April and October, with updates in January and July.


GIPHY App Key not set. Please check settings