 Balakumar L
Introduction
Total economic size and personal wealth are two completely different things, and mixing them up leads to some genuinely misleading headlines. A country can have a massive economy and a comparatively modest income per person, or a tiny population and eye-watering per-capita wealth.
We pulled data directly from the International Monetary Fund’s April 2026 World Economic Outlook to rank the ten richest countries in the world by total nominal GDP, along with what’s actually driving each economy and how per-capita wealth tells a very different story.
Table of Contents
- Key Highlights
- Nominal GDP vs. GDP Per Capita vs. PPP: What Actually Measures “Richest”
- The Top 10 Richest Countries in the World by GDP
- Important Statistics Table
- How These GDP Rankings Are Actually Calculated (Step-by-Step)
- Pros and Cons Table
- Comparison Table: Top 10 Economies at a Glance
- Current Trends Shaping Global GDP Rankings
- FAQs
- References
Key Highlights (Quick Facts)
- The United States remains the world’s largest economy with a projected nominal GDP of approximately $31.8 trillion in 2026, making up roughly a quarter of total global GDP.
- China holds the second spot at approximately $20.65 trillion nominal GDP, but on a purchasing power parity basis, China’s economy reaches an estimated $43.49 trillion, which some economists argue makes it the world’s largest economy by that alternate measure.
- India is projected to overtake Japan as the world’s fourth-largest economy in 2026, fueled by GDP growth of roughly 6.2%, the fastest among the top 50 global economies.
- China’s GDP growth rate for 2026 (approximately 4.16%) is outpacing the United States’ growth rate (approximately 2.10%), gradually narrowing the gap between the two largest economies in percentage terms, even as the US retains an $11.2 trillion absolute lead.
- Despite ranking second by total GDP, China’s GDP per capita sits at just approximately $14,730, ranking around 72nd globally, since its enormous total output gets divided among more than 1.4 billion people.
- Germany overtook Japan to claim the world’s third-largest economy back in 2023 and remains projected at approximately $5.33 trillion for 2026.
- The top 1% of the global population controls an estimated 43% of all financial assets worldwide, while the bottom 50% holds just 0.52% of global wealth.
- Global GDP is forecast to reach approximately $126 trillion in 2026, with roughly $39 trillion, or 31%, coming from just five Anglosphere countries: the United States, Canada, Australia, New Zealand, and the United Kingdom.
The truth is, “richest” depends entirely on which measurement you use. This list ranks by total nominal GDP, the raw size of a country’s economy, which tends to favor large-population countries over small, ultra-wealthy ones like Luxembourg or Singapore.
Nominal GDP vs. GDP Per Capita vs. PPP: What Actually Measures “Richest”
Before ranking the list, here’s what these different economic measurements actually tell you.
Nominal GDP
This measures the total market value of all goods and services a country produces in a year, converted into US dollars at current exchange rates. It’s the simplest comparison, but it naturally favors countries with large populations, which is exactly why this ranking looks so different from a per-capita wealth list.
GDP Per Capita
This divides total GDP by population, showing average economic output per person. It favors small, efficient, or resource-rich economies, which is why microstates like Liechtenstein and Luxembourg top per-capita rankings despite having comparatively tiny total economies.
Purchasing Power Parity (PPP)
PPP adjusts for cost-of-living and price differences between countries, since a dollar buys dramatically more in some countries than others. On a PPP basis, China’s economy is actually larger than the United States’, which is why China’s global economic ranking shifts dramatically depending on which measure you use.
Why This List Uses Nominal GDP
Total nominal GDP is the standard measure for comparing the sheer scale and influence of national economies on global trade, currency markets, and geopolitics, which is why it remains the most commonly cited “richest countries” ranking despite its limitations.
The Top 10 Richest Countries in the World by GDP
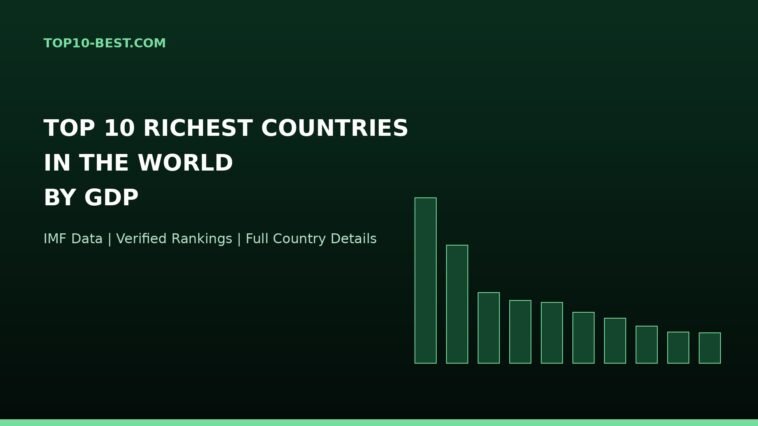
Here is the researched, IMF-sourced ranking of the world’s largest economies by total nominal GDP in 2026.
1. United States
GDP: Approximately $31.8 trillion
What drives it: The US economy runs on a genuinely diversified base spanning technology, financial services, healthcare, and advanced manufacturing, making up roughly a quarter of total global GDP on its own. Real GDP growth is projected at around 2.1% for 2026, driven by continued strength in services, tech innovation, and consumer spending.
Context: Despite its massive total GDP, the US typically falls in the 5th-to-9th range globally for GDP per capita among nations with populations over 50 million, at roughly $86,000 to $93,000 per person, behind smaller economies like Luxembourg, Singapore, Ireland, Switzerland, and Norway.
2. China
GDP: Approximately $20.65 trillion
What drives it: China’s economy leverages its 1.4 billion population to dominate global manufacturing supply chains in electronics, textiles, and increasingly sophisticated technology exports, from smartphones to solar panels. Its 2026 growth rate of approximately 4.16% continues to outpace the United States’ growth rate.
Context: On a purchasing power parity basis, China’s economy reaches an estimated $43.49 trillion, which some economists argue makes it the world’s largest economy by that alternate measure. However, China’s per-capita GDP sits at just approximately $14,730 nominally, ranking around 72nd globally, since its enormous total output is divided among a vastly larger population than most wealthy nations.
A busy container shipping port with cranes loading cargo — global manufacturing and export infrastructure remain central to understanding the difference between total GDP scale and per-person wealth.
3. Germany
GDP: Approximately $5.33 trillion
What drives it: Germany remains Europe’s largest economy, anchored by advanced manufacturing, automotive engineering, and industrial exports. The country overtook Japan to claim the world’s third-largest economy back in 2023 and has held that position since.
Context: Germany also ranks among the top 20 globally for GDP per capita, reflecting a combination of high total output and a comparatively smaller population relative to the top two economies.
4. India
GDP: Approximately $4.51 trillion
What drives it: India is projected to overtake Japan as the world’s fourth-largest economy in 2026, fueled by GDP growth of roughly 6.2%, the fastest growth rate among the world’s top 50 economies. This growth reflects continued expansion in services, technology outsourcing, manufacturing, and a rapidly growing domestic consumer base.
Context: India’s rise to the fourth spot marks a genuinely significant shift in global economic rankings, reflecting sustained multi-year growth rather than a single-year anomaly.
5. Japan
GDP: Approximately $4.46 trillion
What drives it: Japan’s economy remains anchored by advanced manufacturing, automotive production, electronics, and a highly sophisticated export sector, though the country posts the lowest growth rate among the top 50 global economies for 2026.
Context: Japan’s expected slip to fifth place, behind India, reflects a longer-term pattern of slower growth tied to demographic challenges, including an aging population and comparatively low population growth relative to faster-expanding economies.
A modern city skyline with illuminated skyscrapers at dusk — advanced manufacturing and technology exports remain central pillars for several of the world’s largest developed economies.
6. United Kingdom
GDP: Approximately $3.96 trillion
What drives it: The UK economy is built around financial services, particularly London’s role as a global financial hub, alongside professional services, technology, and a diversified services sector that makes up the majority of national output.
Context: The UK ranks among the five countries, alongside the US, Canada, Australia, and New Zealand, that together generate roughly $39 trillion, or 31%, of total forecast global GDP in 2026.
7. France
GDP: Approximately $3.36 trillion
What drives it: France’s economy spans luxury goods manufacturing, aerospace, agriculture, tourism, and a substantial nuclear energy sector, giving it one of the more diversified economic bases among major European economies.
Context: France remains the third-largest economy in the European Union by total GDP, behind Germany, continuing to anchor the eurozone alongside its German counterpart.
8. Italy
GDP: Approximately $2.54 trillion
What drives it: Italy’s economy relies heavily on manufacturing, particularly in fashion, automotive, and industrial machinery, alongside a substantial tourism sector drawing visitors from around the world.
Context: Italy remains the third-largest economy in the eurozone by total GDP, trailing Germany and France, and continues facing slower growth relative to some faster-expanding global economies.
9. Canada
GDP: Approximately $2.28 trillion
What drives it: Canada’s economy benefits from substantial natural resource exports, including oil, natural gas, and minerals, alongside a diversified services sector and close economic integration with the United States as its largest trading partner.
Context: Canada ranks among the five core Anglosphere economies contributing a disproportionate share of total global GDP relative to their combined population.
10. Brazil
GDP: Approximately $2.26 trillion
What drives it: Brazil’s economy is anchored by agriculture, including major global exports of soybeans, coffee, and beef, alongside mining, manufacturing, and a substantial domestic consumer market as Latin America’s largest economy.
Context: Brazil rounds out the top 10, holding its position as the largest economy in South America and one of the most significant emerging-market economies globally.
A wheat or soybean field extending toward the horizon under a clear sky — large-scale agricultural exports remain a defining pillar of several major global economies, including Brazil and the United States.
Important Statistics Table
| Rank | Country | Nominal GDP (2026, approx.) | 2026 Growth Rate (approx.) |
|---|---|---|---|
| 1 | United States | $31.8 trillion | 2.1% |
| 2 | China | $20.65 trillion | 4.16% |
| 3 | Germany | $5.33 trillion | Moderate growth |
| 4 | India | $4.51 trillion | 6.2% (fastest in top 50) |
| 5 | Japan | $4.46 trillion | Lowest among top 50 |
| 6 | United Kingdom | $3.96 trillion | Moderate growth |
| 7 | France | $3.36 trillion | Moderate growth |
| 8 | Italy | $2.54 trillion | Moderate growth |
| 9 | Canada | $2.28 trillion | Moderate growth |
| 10 | Brazil | $2.26 trillion | Moderate growth |
How These GDP Rankings Are Actually Calculated (Step-by-Step)
- National statistical agencies report economic output data for goods and services produced within their borders over the year.
- The IMF compiles this data into its World Economic Outlook (WEO) database, published twice yearly in April and October, incorporating both confirmed historical data and forward-looking projections.
- Figures get converted to US dollars at current market exchange rates for nominal GDP comparisons, which means currency fluctuations can meaningfully shift a country’s ranking year to year.
- Growth projections get layered onto the most recent confirmed baseline, using economic modeling that accounts for trade patterns, domestic consumption trends, and other macroeconomic indicators.
- Rankings get published and periodically revised as more current data becomes available, meaning the specific figures in projections like these can shift somewhat between the April and October WEO releases.
- Alternative measures like PPP and per-capita GDP are calculated using the same underlying data but adjusted for either population size or domestic price levels, producing meaningfully different rankings from the same source data.
Pros and Cons Table
| Aspect | Nominal GDP Ranking Pros | Nominal GDP Ranking Cons |
|---|---|---|
| Comparability | Simple, uses a single consistent currency standard | Doesn’t account for cost-of-living differences between countries |
| Global influence | Reflects real economic and geopolitical weight | Can overstate a country’s average citizen’s actual wealth |
| Market relevance | Widely used in trade, currency, and investment analysis | Sensitive to exchange rate swings, not just real economic change |
| Population factor | Reflects true scale of national economic output | Favors large-population countries over efficient smaller ones |
| Historical consistency | Long track record, comparable across decades | Doesn’t capture wealth distribution or inequality within a country |
Comparison Table: Top 10 Economies at a Glance
| Country | Primary Economic Drivers | Region | EU/Eurozone Member |
|---|---|---|---|
| United States | Technology, finance, healthcare, manufacturing | North America | No |
| China | Manufacturing, exports, technology | East Asia | No |
| Germany | Advanced manufacturing, automotive, exports | Europe | Yes |
| India | Services, technology outsourcing, manufacturing | South Asia | No |
| Japan | Manufacturing, automotive, electronics | East Asia | No |
| United Kingdom | Financial services, professional services | Europe | No |
| France | Luxury goods, aerospace, agriculture, tourism | Europe | Yes |
| Italy | Manufacturing, fashion, tourism | Europe | Yes |
| Canada | Natural resources, services | North America | No |
| Brazil | Agriculture, mining, manufacturing | South America | No |
A world map style visualization with major financial hubs highlighted — the global distribution of economic output remains heavily concentrated among a small number of countries.
Current Trends Shaping Global GDP Rankings
Global GDP rankings keep shifting, and a few clear patterns stand out in the most recent IMF projections.
India’s Rise Is Reshaping the Global Top Five
India’s projected overtaking of Japan in 2026, driven by roughly 6.2% growth, the fastest among the top 50 economies, marks one of the most significant shifts in the global economic order in recent years.
The US-China Gap Is Narrowing in Percentage Terms
While the United States maintains an $11.2 trillion absolute lead over China, China’s faster growth rate (approximately 4.16% versus the US’s 2.10%) means the percentage gap between the two economies continues to close gradually.
Nominal Versus PPP Rankings Are Diverging Further
The gap between China’s nominal GDP ranking (second) and its PPP-based ranking (arguably first, at $43.49 trillion) continues widening, fueling ongoing debate among economists about which measure more accurately reflects true economic scale.
Wealth Concentration Remains Extreme Globally
The top 1% of the global population controls an estimated 43% of all financial assets, while the bottom 50% holds just 0.52% of global wealth, a stark reminder that total GDP size says little about how prosperity is actually distributed within or between nations.
Currency Strength Is Reshaping Per-Capita Rankings
Dollar strength has measurably compressed the dollar-denominated per-capita incomes of several European economies in 2026, meaning rankings 11 through 20 by GDP per capita remain especially sensitive to exchange rate swings throughout the year.
FAQs About the Richest Countries in the World by GDP
What is the richest country in the world by total GDP? The United States remains the world’s largest economy by total nominal GDP, projected at approximately $31.8 trillion in 2026, making up roughly a quarter of global GDP on its own.
Is China richer than the United States? It depends on the measure. The US leads by nominal GDP ($31.8 trillion versus China’s $20.65 trillion), but on a purchasing power parity basis, China’s economy reaches an estimated $43.49 trillion, which some economists argue makes it the world’s largest economy by that measure.
Why does India rank higher than countries with a higher GDP per capita? This ranking measures total nominal GDP, which reflects the overall scale of a country’s economy rather than average income per person. India’s massive population combined with strong 6.2% growth pushes its total economic output ahead of smaller, wealthier-per-capita nations.
Is GDP per capita a better measure of a country’s wealth than total GDP? It depends on what you’re trying to measure. Total GDP reflects overall economic scale and global influence, while GDP per capita better reflects the average individual’s economic standard of living, and the two rankings can look completely different.
Why did Japan drop behind India in the rankings? Japan posts the lowest growth rate among the world’s top 50 economies for 2026, reflecting longer-term demographic challenges including an aging population, while India’s roughly 6.2% growth rate is the fastest in the same group.
How often does the IMF update these GDP figures? The IMF publishes its World Economic Outlook data twice yearly, in April and October, incorporating updated historical data and revised projections, meaning rankings and specific figures can shift somewhat between releases.
Do these rankings account for cost of living differences between countries? No. Nominal GDP rankings like this one use current market exchange rates without adjusting for cost of living. Purchasing power parity (PPP) rankings, which use the same underlying data but adjust for domestic price levels, can produce meaningfully different results.
Conclusion
The world’s ten richest countries by total GDP reflect raw economic scale, not necessarily average individual prosperity, which is exactly why the United States and China dominate this list despite very different per-capita wealth realities. India’s projected rise past Japan marks a genuinely significant shift in the global economic order, while the growing gap between nominal and PPP measures of China’s economy continues fueling real debate among economists. Whichever measure you trust most, one thing is clear: the concentration of global economic output among a small handful of countries remains as pronounced as ever.
References
- International Monetary Fund — World Economic Outlook (April 2026), GDP Current Prices
- International Monetary Fund — World Economic Outlook (April 2026), GDP Per Capita
- Wikipedia — List of Countries by GDP (Nominal)
- Worldometers — GDP by Country 2026, IMF Data
- StatisticsTimes.com — World GDP Ranking 2026
- Union Citizenship — Richest Countries in the World 2026: GDP Per Capita, GDP and GNI Rankings
- Global Citizen Solutions — The 20 Richest Countries in the World in 2026
- Financer.com — Richest Country in the World 2026: Top 10 Nations
- Statistics of the World — Top 20 Richest Countries in the World 2026, GDP Per Capita
- UBS — Global Wealth Report 2025
- Oxfam — Global Wealth Inequality Data and Analysis
- Central Statistics Office (Ireland) — 2025 Goods Exports Data



GIPHY App Key not set. Please check settings